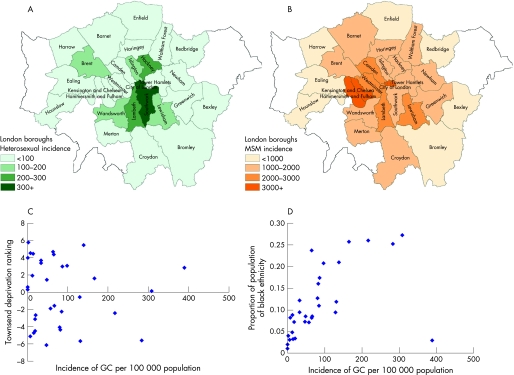
Figure 1 Incidence of gonorrhoea (GC) over the 6 month period by census district. (A) Incidence of cases in heterosexuals as proportion of total heterosexual population. (B) Incidence of cases in MSM using estimated number of MSM as population at risk. (C) Relation between incidence of cases in heterosexuals and Townsend's rank measure of social deprivation. (D) Relation between incidence of cases in heterosexuals and the proportion of the population aged 16–59 of black ethnicity. For (C) and (D) each point in the figure represents an estimate of incidence in a district. The outlier with high incidence and low social deprivation in (C) is the City of London.

An official website of the United States government
Here's how you know
Official websites use .gov
A
.gov website belongs to an official
government organization in the United States.
Secure .gov websites use HTTPS
A lock (
) or https:// means you've safely
connected to the .gov website. Share sensitive
information only on official, secure websites.
