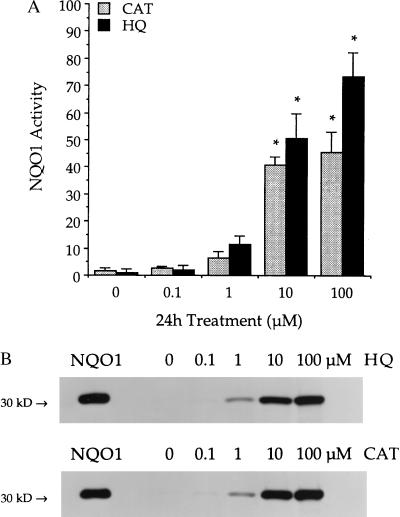
Figure 1.
NQO1 induction in KG-1a cells exposed to benzene metabolites. (A) NQO1 activity was measured after treatment with 0–100 μM HQ (black bars) or 0–100 μM CAT (gray bars) for 24 h. Activities are reported as nmol 2,6-dichlorophenol-indophenol reduced/min per mg cellular protein. Data are presented as mean ± SD (n = 3). ∗, Significantly greater than control (P ≤ 0.05). (B) NQO1 protein was determined by immunoblot analysis after above treatments. Purified recombinant human NQO1 protein (5 ng) was included as a standard (NQO1). Immunoblots are representative of three separate experiments for each compound.

