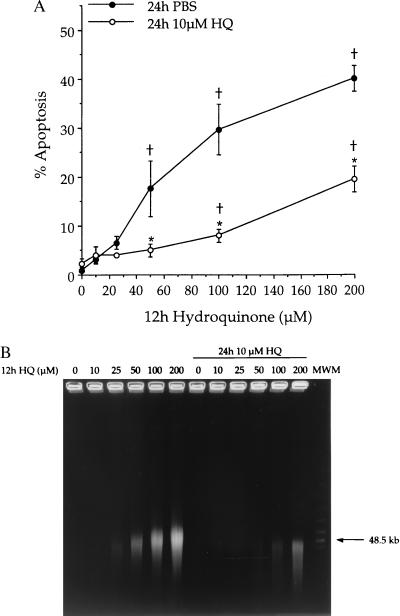
Figure 3.
Protection against HQ-induced apoptosis in KG-1a cells after induction of NQO1. Cells were pretreated with 10 μM HQ (○) or vehicle control (PBS, ●) for 24 h. Subsequently, cells were treated with HQ (0–200 μM) for 12 h after which apoptosis was measured. (A) Apoptosis was determined based on morphological criteria. Data are presented as mean percentage apoptotic cells ± SD (n = 3). †, Percentage of apoptosis is significantly greater than control (P ≤ 0.05). ∗, Protection is significant (P ≤ 0.05). (B) Chromatin degradation into large fragments was measured by field inversion gel electrophoresis. Gel is representative of three separate experiments.

