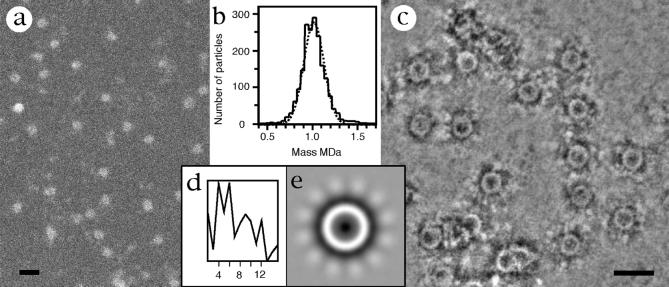
Figure 2.
STEM analysis of purified PulD complex. (a) Dark-field STEM micrograph of unstained PulD complex. (b) Histogram of masses of unstained PulD complex. (c) STEM micrograph of PulD complex stained with uranyl formate. (d) Averaged angular power spectrum from 256 selected top views, illustrating the presence of four, six, nine, and 12 angular harmonics. (e) Averaged image of PulD showing the 12 radial spokes. (Scale bar represents 20 nm.)

