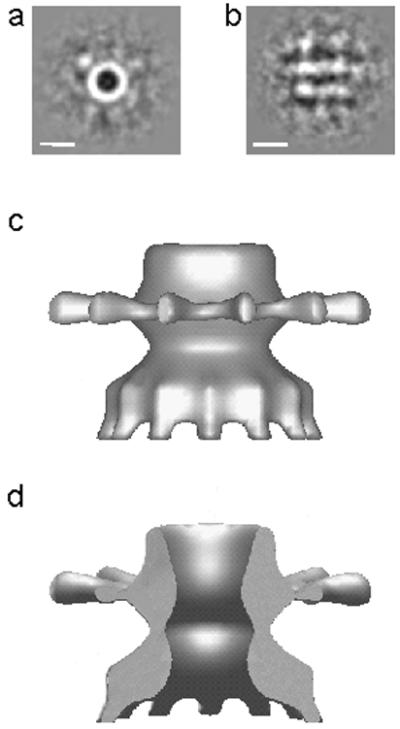
Figure 3.

Cryo-EM analysis of unstained preparations of purified PulD-PulS complex. Average end (a) and side (b) views of the PulD-PulS complex. The scale bar in a and b represents 10 nm. A 3D model of the PulD-PulS complex (c) has been sectioned (d), removing the front of the complex so that the channel and profile of the rings can be clearly seen.
