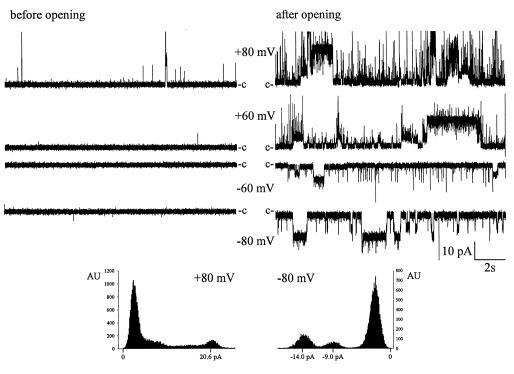
Figure 5.
Channel activity before and after activation at high membrane potential. Conditions in the cis and trans compartments were as in Fig. 4. (Upper) Trace recordings illustrating the channel activity at different membrane potentials before activation (Left) and after activation at high membrane potential (Right). (Lower) Amplitude histograms (15-sec recordings) at +80 mV and −80 mV, respectively, showing two well-defined transitions at negative potential.

