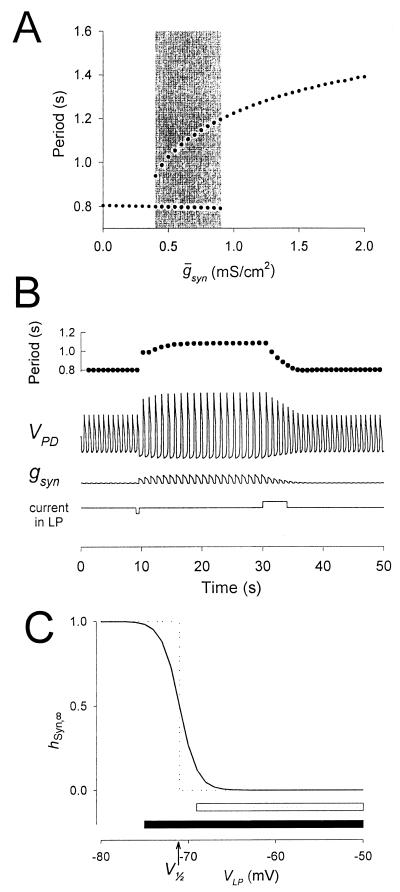
Figure 4.
The switch mechanism can produce bistability in the network oscillations. Same model parameters as in Fig. 3A, but the time constant for recovery from depression of the LP–PD synapse is halved (see Methods). (A) Hysteresis seen in the model oscillation period plotted against maximal conductance ( syn) of the LP–PD synapse. This plot shows the period of oscillation for 84 simulation runs. From run to run,
  syn was incrementally increased (from 0 to 2, in steps of 0.05; all units in mS/cm2). For each run, the period after the transient was measured. The end point of each simulation run was used as the initial point in the next run. The shaded area highlights the region of bistability. (B) Bistability shown in the model time traces of the LP–PD synaptic conductance (gsyn) and the membrane potential of the PD neuron for
  syn = 0.6 mS/cm2 (within the shaded region in A). Also shown is the cycle-to-cycle period of oscillation. From t = 9 to 9.5 sec, a negative current (−0.1 μA/cm2) was injected in the LP neuron. This transient current switched the rhythm from a fast period (800 msec) to a slow period (1,090 msec), and the amplitude of the PD neuron membrane potential excursions also increased. From t = 30 to 34 sec, a positive current (+0.1 μA/cm2) was injected in the LP neuron. This transient current switched the rhythm back to the initial fast oscillation. (C) Synaptic depression curve hSyn,∞ for the LP–PD synapse as shown in Fig. 3B (solid line) and as a step function (dotted line) centered at V1/2. Shown below the curves are the range of the VLP values during oscillations in the pacemaker-dominated (open bar) and the synapse-dominated (filled bar) regimes.

