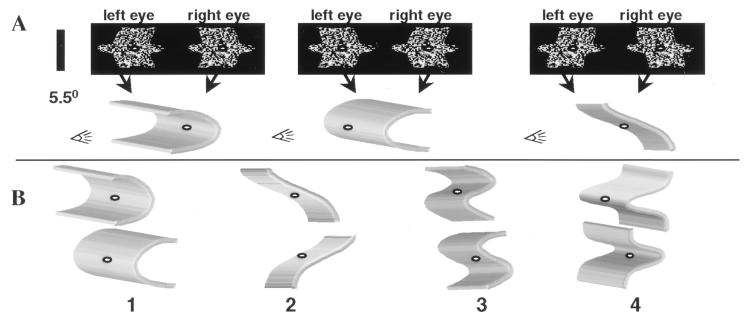
Figure 1.
(A) Monocular images presented to left eye and right eye (Upper) and schematic illustrations of the perceived 3D structure (Lower). Left and Center illustrate a pair of 3D shapes having the same two monocular images. Exchanging the monocular images results in concave surfaces being perceived as convex and vice versa (compare Left and Center). On the Right are shown the monocular images of another 3D shape, derived from the same 2D shape as the two other 3D shapes. (B) Illustration of the eight different depth profiles that are grouped into four pairs (1–4). The profiles of the first three pairs are derived from a sine function, whereas a Gaussian function defines the depth profile of the last pair. Note that in the stimuli used in the experiment, depth was defined by binocular disparity only. Shading and perspective are used merely to illustrate the perceived depth of the stimuli. Moreover, the schematic illustration of the depth profiles does not show the actual borders of the stimulus.

