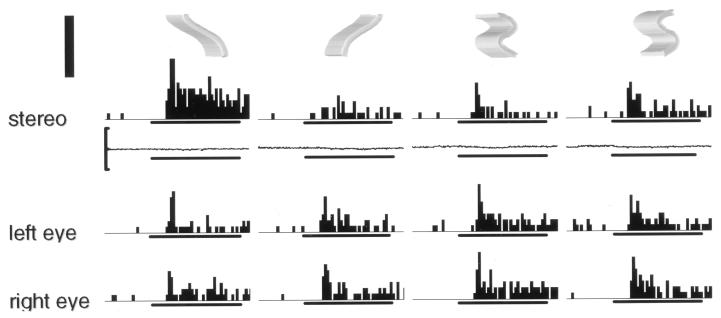
Figure 2.
Selectivity of a TE neuron for disparity-defined 3D shape. The top row shows profiles of the two pairs of 3D stimuli with which the neuron was tested. The second row shows the peristimulus-time histograms of the neuronal responses to the dichoptic presentation (stereo), together with the mean horizontal eye position in these conditions. The two bottom rows are the responses to monocular presentation of the images to the left eye and to the right eye. The horizontal bars below each histogram and below the eye movement traces indicate the duration of stimulus presentation (800 ms); the vertical calibration along the eye position traces indicates ±1 deg, and the thick vertical bar (top left corner), 80 spikes/sec. Notice the large difference between the stereo responses to the two left-sided 3D shapes. This difference cannot be accounted for by the difference between the sums of the monocular responses.

