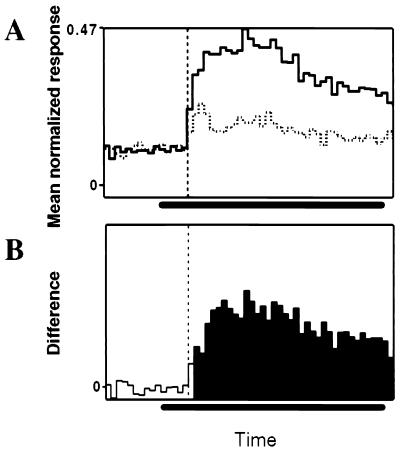
Figure 3.
(A) Population peristimulus-time histogram of 3D-shape selective neurons (n = 56). The solid line represents the population response to the preferred 3D shape and the dotted line, the population response to the nonpreferred 3D shape (bin width, 20 ms). The vertical dashed line indicates the onset of the population response, and the horizontal bar indicates the duration of stimulus presentation. (B) Difference between the normalized responses to preferred and unpreferred 3D shape plotted as a function of time. Open bins indicate nonsignificant differences in normalized response, filled bins, significant differences.

