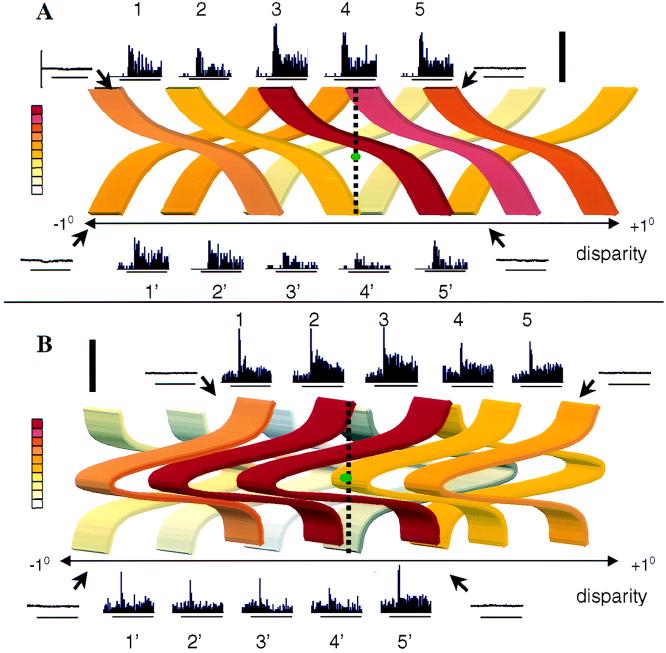
Figure 4.
Neuronal responses in position-in-depth test. (A) Responses of the same neuron as in Fig. 2. (B) Responses of another TE neuron, tested with Gaussian depth profiles. The depth profiles of the stimuli are shown as positioned in depth, and the colors represent the net average firing rate of the neuron: red, 30 spikes/sec; white, 0 spikes/sec. The plane of fixation is indicated by the vertical dotted line (near disparities are to the left, far disparities to the right); the green dot represents the fixation point. The peristimulus-time histograms of the responses to the preferred 3D shape at five positions in depth (positions 1–5) are illustrated on top of the depth profiles, whereas the responses to the nonpreferred stimulus (positions 1′–5′) are shown below. Horizontal bars indicate the duration of stimulus presentation (800 ms), and the thick vertical bar indicates 70 and 100 spikes/sec in A and B, respectively. Eye movement traces are shown for the extreme stimulus presentations (positions 1, 1′, 5, and 5′). The vertical calibration along the eye position trace indicates ±1 deg.

