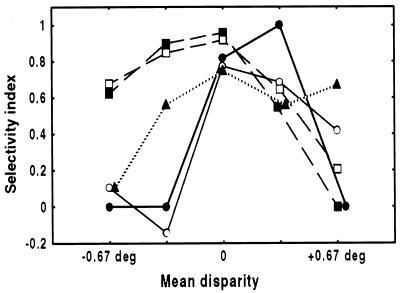
Figure 5.
Selectivity for 3D shape depends on the average depth of the shape. The selectivity index is plotted as a function of the mean disparity for five TE neurons. To prevent spuriously large indices, the index was set to zero for responses smaller than three spikes/sec (which generally did not differ significantly from zero). Solid lines are two examples of neurons where 3D selectivity predominates in the plane of fixation, dashed lines are neurons where selectivity predominates at near disparities, and the dotted line represents an example of a neuron that is selective at far disparities. Open circles and open squares are the neurons shown in Fig. 4 A and B, respectively.

