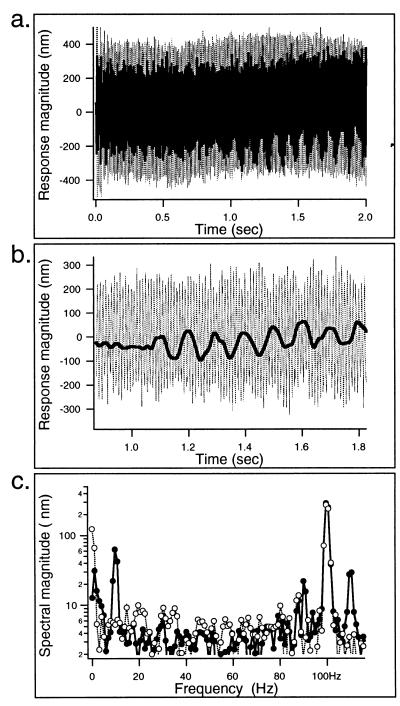
Figure 2.
(a) Responses obtained during whole–cell voltage–clamp experiment (as in Fig. 1a). Free-fiber motion in response to 100-Hz sinusoidal drive (thin dotted lines) and loaded-fiber response during stimulation of electromotility (by a 10-Hz, 40-mV signal) during the second half of the mechanical input (superimposed heavy line). Comparison of the first 1-s period of loaded- and free-fiber motions provides an indication of secure contact between fiber and cell by indicating that the former is considerably smaller than the latter (ζ = 0.53; Eq. 2). (b) High-pass filtered loaded-fiber motion during elicitation of motile response (thin dotted line) in comparison with the low-pass filtered (superimposed solid line) version of the same response. The latter represents the loaded electromotile response of the cell. In b, a segment of the response from a is shown on an expanded time scale. Note the apparent amplitude modulation in the high-frequency response. Upward deflections in the low-pass filtered response reflect cell elongation (during hyperpolarization). (c) Fourier spectra of the first (open circles) and second 1-s periods (filled circles) of the loaded-fiber waveform from Fig. 2a. Note the presence of intermodulation components at 90 and 110 Hz, aside from energy at 10 Hz (electromotile response) and 100 Hz (mechanical driving signal), in the trace representing the second half of the response. Also note the absence of these components (and of course the 10-Hz component representing the electromotile response) during the first period. Resting cell length = 60 μm.

