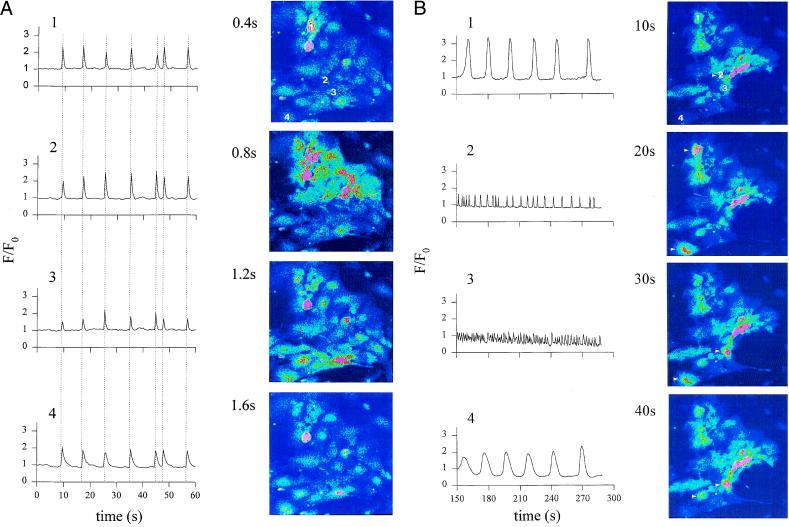
Figure 4.
CLSM images of [Ca2+]i oscillations in a spontaneously contracting area of cardiomyocytes isolated from a stage-2 EB. (A) Control conditions. A [Ca2+]i wave spread with a velocity of ≈400 μm⋅sec−1 from the initiation site (cell 1) to the termination site (cell 4). The tracings of [Ca2+]i changes in different cells (cell 1–4) demonstrate the synchronization of the [Ca2+]i signal, indicating electrical coupling between adjacent cells. (B) [Ca2+]i oscillations recorded in the same area of cardiomyocytes after superfusion with high K+. The images were recorded after decline toward resting [Ca2+]i of the initial transient [Ca2+]i rise after switching to high K+. The initial [Ca2+]i increase was caused by the activation of VDCC. Note that, under high K+ [Ca2+]i, oscillations in cells 1–4 are desynchronized and differ in amplitude and frequency.

