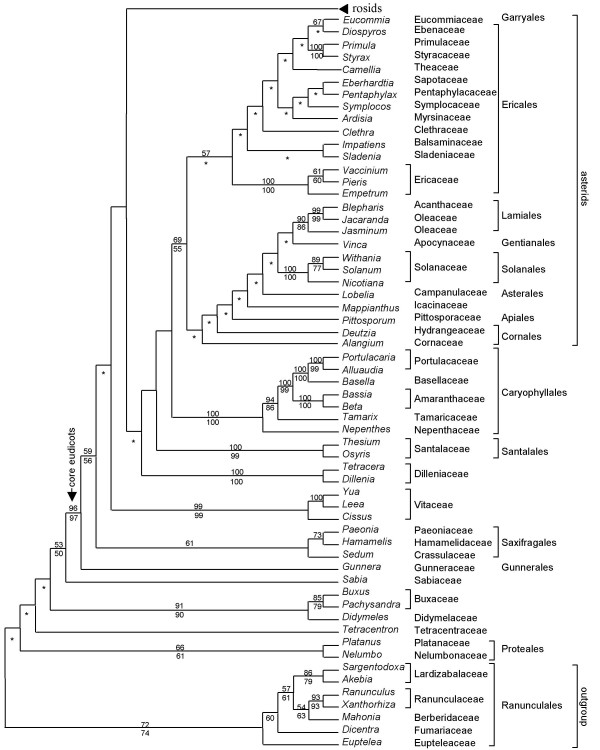
Figure 2.
ML tree (eudicots excluding rosid clade) from the 174-taxon matrix of matR. The numbers above branches are ML BS percentages >50; those below are MP BS percentages >50. For nodes where ML and MP analyses differ in topology, only the ML BS percentages are shown; asterisks denote contradictory resolutions between ML tree and MP strict consensus of all shortest trees.

