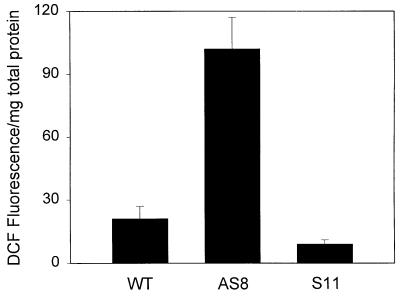
Figure 1.
Intracellular ROS abundance in WT and Aox1 transgenic cultured tobacco cells. Intracellular ROS was measured by using H2DCF-DA as described in Materials and Methods. Measurements were made by using cells 3–4 days after subculture. Results represent the means (± SD) of six to eight separate experiments. AS8, Aox1 antisense; S11, Aox1 overexpresser.

