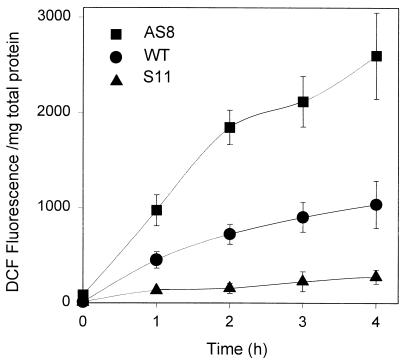
Figure 2.
ROS formation in WT and Aox1 transgenic cultured tobacco cells after inhibition of cytochrome c electron transport. Time course of ROS production after addition of antimycin A (5 μM) to intact cells at t = 0. At each time point, an aliquot of cells was removed and incubated with H2DCF-DA for 30 min before fluorescence measurement. ●, WT; ■, AS8; ▴, S11. Results represent the means (± SD) of four separate experiments.

