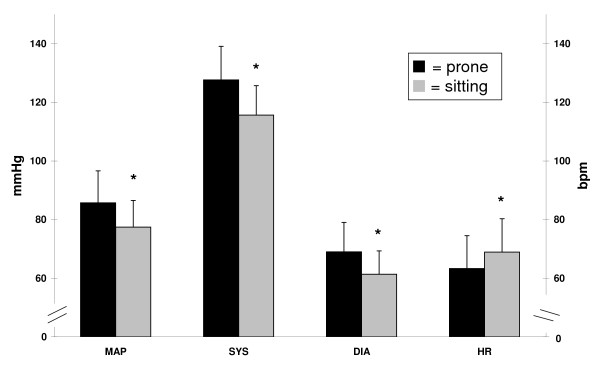
Figure 2.
Comparison of BP and HR between the horizontal (prone ▪) and vertical (sitting  ) postures. Expressed as mean ± SD and compared using the paired t-tests. Left scale applies to MAP, SYS, and DIA, right scale only to HR; DIA = diastolic blood pressure, HR = heart rate, MAP = mean arterial pressure, SYS = systolic blood pressure, BPM = beats per minute, and * = statistically significant difference from a value in the prone posture.

