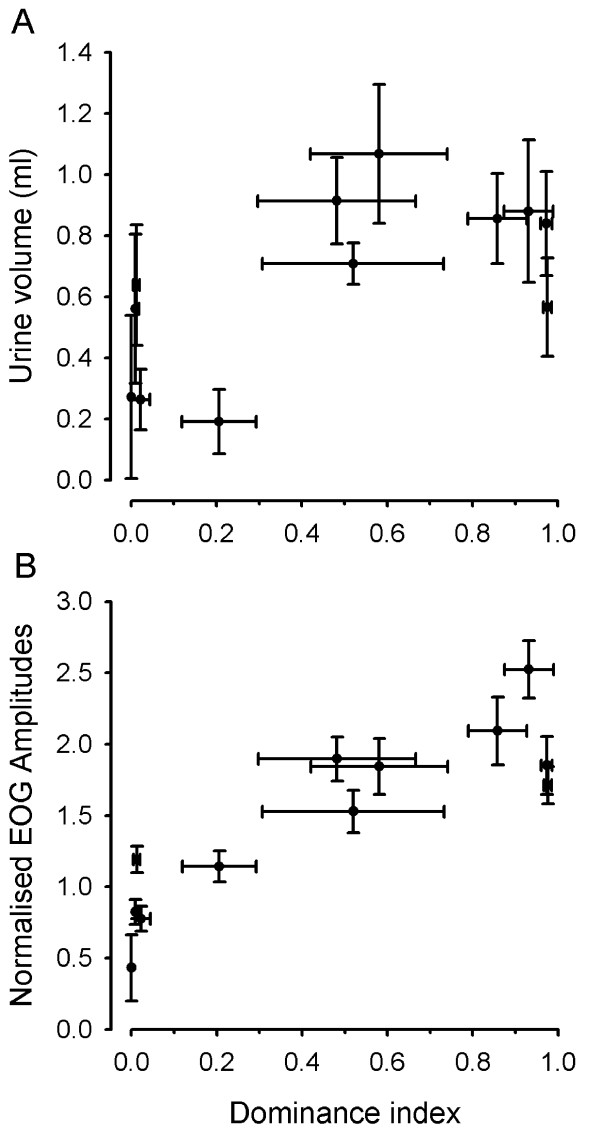
Figure 4.
Urine volume, urine olfactory potency and dominance index of donor male tilapia in a community tank. (A) Scatter plot of urine volume (mean ± SEM, n = 5 days) collected from males (n = 12) and their Di (mean ± SEM, n = 5 days) during 5 days in a community tank with females. The mean urine volume collected from the five subordinate males (Di between 0.0 and 0.21) was significantly smaller (0.39 ± 0.09 ml) than that collected from males of higher social rank (0.83 ± 0.06 ml; Student's t test, t10 = 4.330, p < 0.005). (B) Scatter plot of EOG amplitudes (mean ± SEM, n = 30) elicited by male urine (1:104 v/v in water) and the dominance index (mean ± SEM, n = 5 days) of donor males (n = 12). The urine of subordinate males evoked significantly smaller normalized EOG responses (0.87 ± 0.14) than that of higher rank males (1.92 ± 0.12; t10 = 5.715, p < 0.001).

