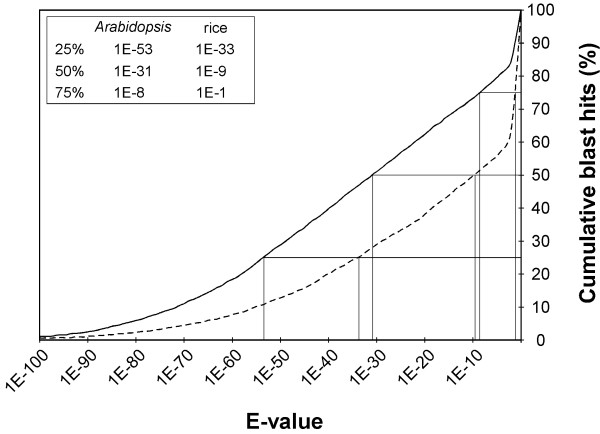
Figure 4.
Cumulative count of homologs of Arabidopsis and rice. All the CDS of both Arabidopsis and rice were compared with the PnFL ESTs by using the tblastx program. The curves depict the percentages of genes in the Arabidopsis (solid line) and the rice (broken line) genomes that have greater sequence similarity than the E value ascribed to a corresponding sequence in the PnFL ESTs. For instance, as shown in the inset, 50% of the genes have a hit with an E value of < 10-31 in Arabidopsis and of < 10-9 in rice.

