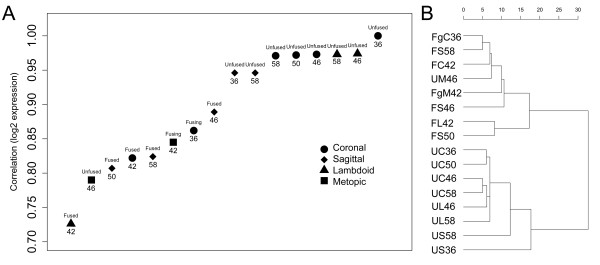
Figure 2.
Microarray sample correlations based on a selected gene list (fused v unfused, P < 0.1). Correlations are based on genes differentially expressed (P < 0.1) between unfused and fused sutures for combined samples from coronal, lambdoid and sagittal sutures. A) Correlation to the unfused coronal suture from patient #36 shows a gradient of correlation between unfused, fusing and fused sutures. The unfused metopic suture groups with fused sutures. Patient number is recorded below data points and state of fusion above data points. B) Hierarchical clustering separates suture data into unfused and fusing/fused sutures. Unfused lambdoid and coronal sutures are more related to each other than they are to sagittal sutures. U, unfused; Fg, fusing; F, fused; C, coronal; S, sagittal; L, lambdoid; M, metopic; patient number follows sample identifier.

