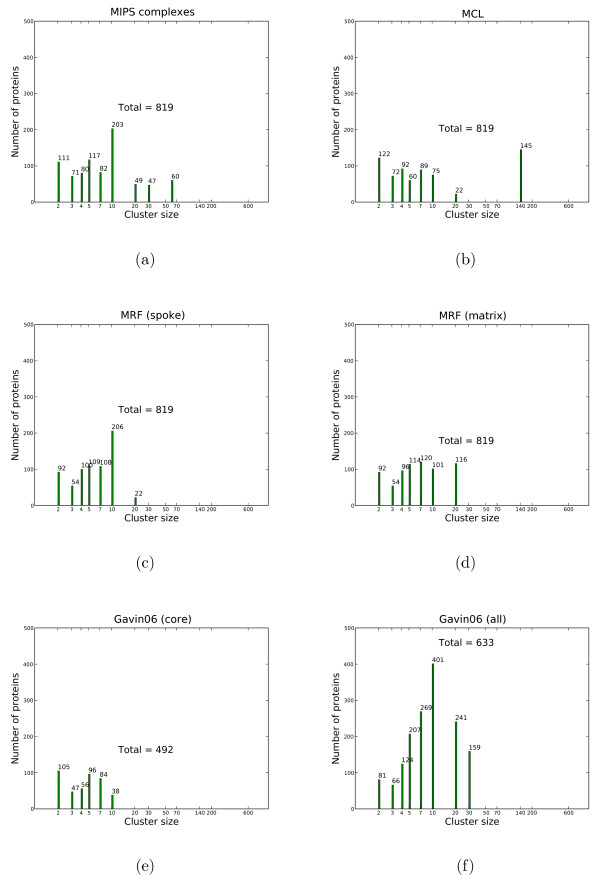
Figure 5.
Cluster sizes by MIPS proteins on the Gavin06 set. The x-axis shows cluster sizes in log-scale. The y-axis shows the number of proteins in a cluster of certain size by proteins found in MIPS complexes. Note, that singletons and proteins not contained in the MIPS set are not considered. Each column also shows the total number of proteins. Cluster sizes are taken from either the primary data source – MIPS(a), Gavin06 (core) (e) and Gavin06 (all) (f) – or solutions obtained on the Gavin06 data set – MCL(b), MRF (spoke)(c), MRF (matrix) (d).

