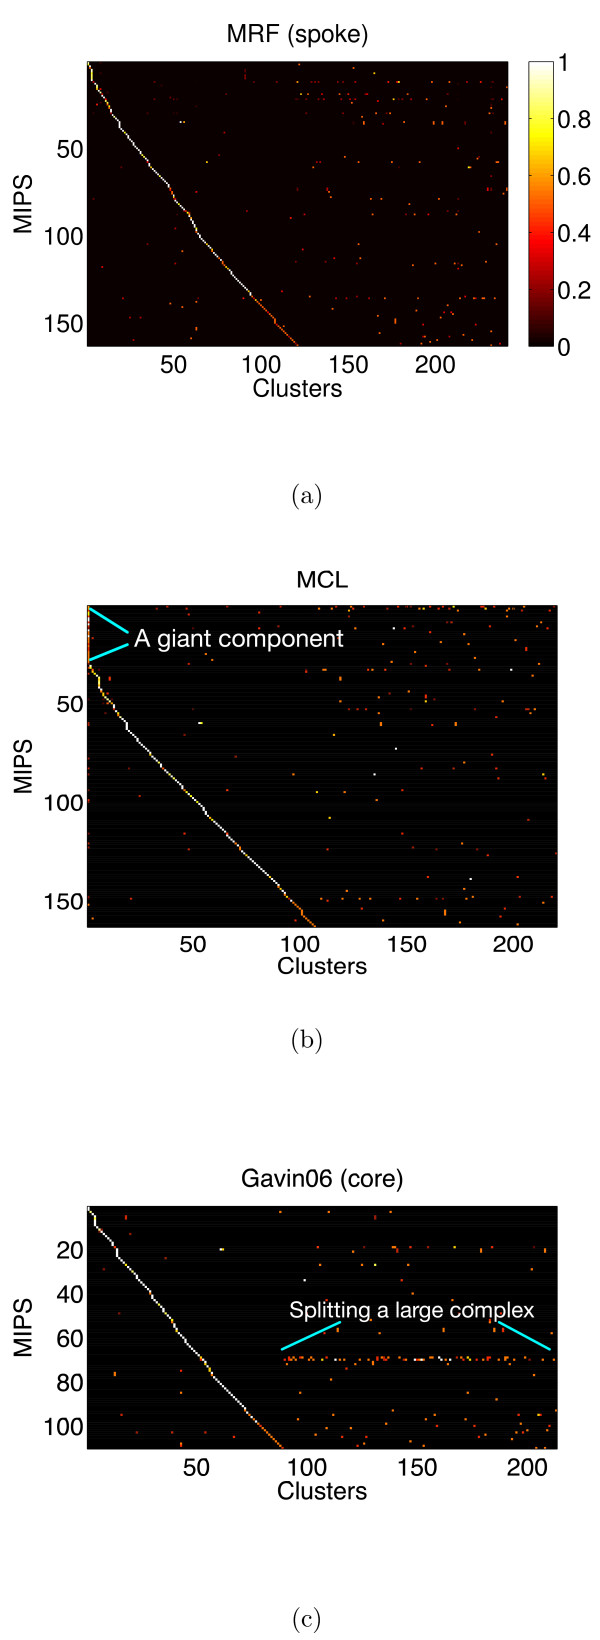
Figure 7.
Mapping to the MIPS complexes. Visualization of the best mapping to the MIPS complexes on the Gavin06 data set. Figures are contingency tables where each cell is the Simpson coefficient with values from [0, 1]. We show three solutions from MRF (spoke) (a), MCL (b) and the core set of Gavin06 (c). Rows are MIPS complexes and columns are clusters obtained using the respective algorithm. The order of complexes and clusters differ between figures. Complexes without mapping to any cluster are not part of a table and likewise for clusters without mapping to any complex. Each figure has a different range of the x-axis and y-axis, because each solution has a different number of clusters mapping to a different subset of the MIPS complexes. The Gavin06 (core) solution maps to fewer complexes because it assigns fewer proteins.

