Figure 1.
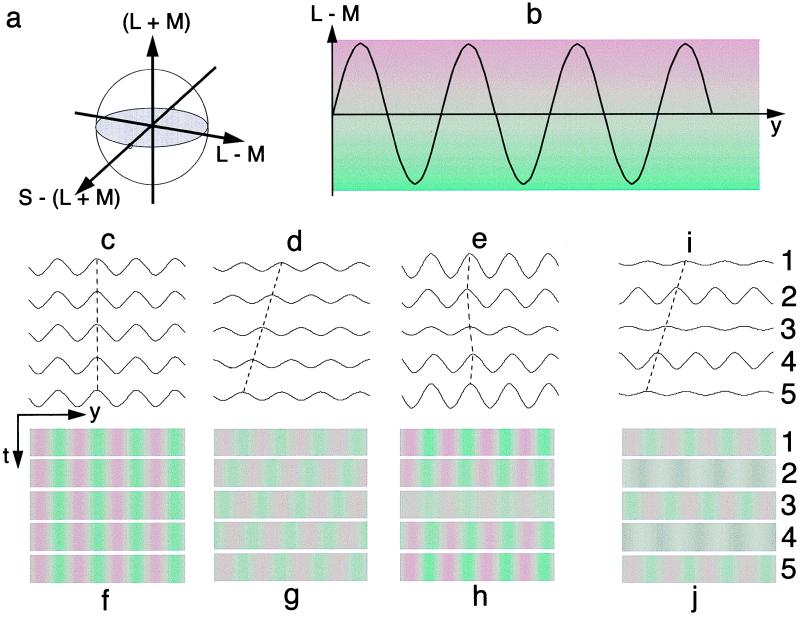
Experimental Setup. (a) Color space and its three cardinal axis: luminance (L + M), red–green (L − M), and blue–yellow [S − (L + M)]. L, long (red); M, middle (green); S, short (blue) wavelength-sensitive cones. (b) Isoluminant spatial sinusoidal modulation along the L − M color axis. (c and f) The pedestal: five frames of an isoluminant stationary sinewave grating. (d and g) The moving sine grating: five isoluminant frames with a phase shift of 90 degrees between successive frames. (e and h) Pedestaled stimulus: summation of c and f and d and g. In pedestaled motion, features such as peaks, valleys, and zero crossings simply wobble back and forth periodically over time. Only wobble, not the constant linear motion of the motion stimulus, could be perceived if motion were computed by an algorithm that first extracted the features. On the other hand, Lu and Sperling (30) proved that, if the perceptual mechanism used a motion–energy computation, human observers would perceive motion equally from the pedestaled motion stimulus and the non-pedestaled motion stimulus. (i and j) Calibration stimulus: a five-frame display in which the odd frames are isoluminant sinewave gratings; the even frames are luminance sinewave modulations; and the phase shift between successive frames is 90 degrees. No consistent motion would be perceived in such a display if the isoluminant frames were truly isoluminant. In the actual experiments, the gratings were horizontal to avoid pixel-to-pixel intensity dependencies in the display monitor and to minimize chromatic aberration (40–42).

