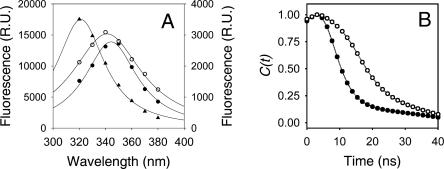
Figure 4.
(A) Decay-class associated spectra of τ1 (●, right scale), τ2 (▲, left scale), and τ3 (○, right scale) components of R61 fluorescence. The excitation wavelength was 295 nm and the conditions are as in Figure 1. (B) Correlation function of R61 fluorescence in H2O (●) and D2O (○) as calculated from the steady-state and time-resolved fluorescence data (Equation 2).

