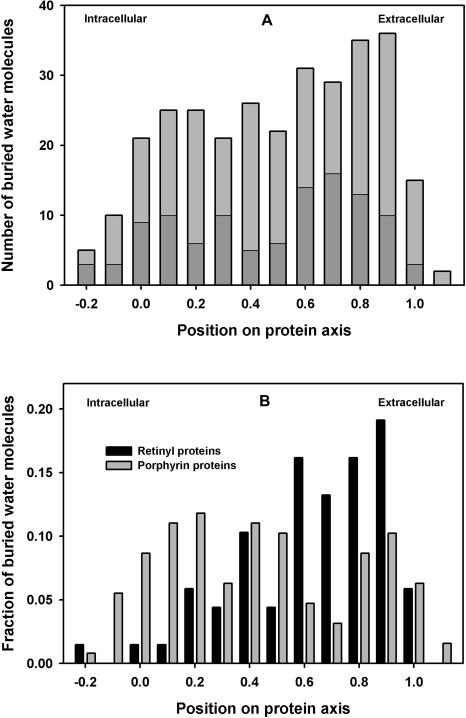
Figure 6.
Locations of buried water positions in the transmembrane profile. A transmembrane protein axis was created by calculating protein poles at the intracellular and extracellular membrane surfaces (see text). Water positions were projected onto the protein axis. (A) Histogram of all waters in proteins from Table 1. Shaded bars exclude proteins in Figure 6B. (B) Separate histograms of two functional groups, retinyl proteins and heme- or chlorophyll-binding proteins.

