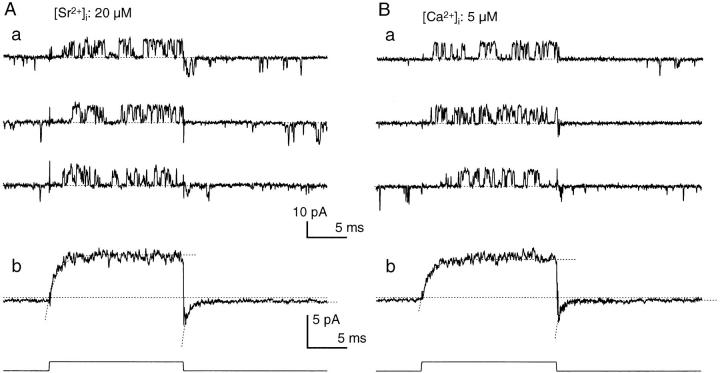
Figure 4.
Response of a single BK channel to voltage steps under the presence of Sr2+ or Ca2+. (A and B) Three sample records (a) and the average trace (b) under the presence of 20 μM [Sr2+]i (A) and 5 μM [Ca2+]i (B). Number of traces used to obtain the average: 100 and 160 in A and B, respectively. The time constants of single-exponential curves that fit the activation and tail-decay time courses (dotted curves) were 1.22 and 0.61 ms, respectively, in A, and 1.14 and 0.54 ms, respectively, in B.

