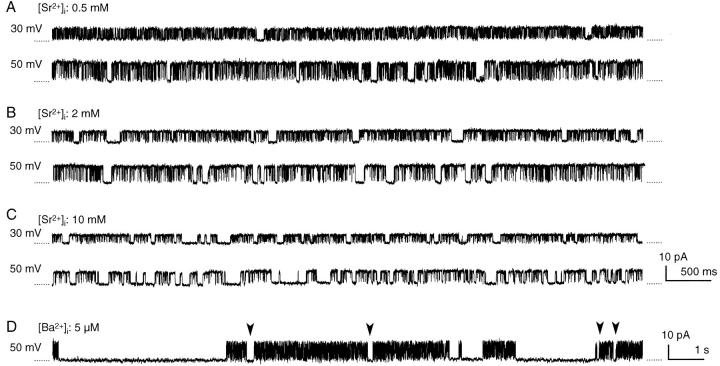
Figure 7.
Long shut events produced by high [Sr2+]i and by [Ba2+]i. (A–C) Sample records were obtained from a BK channel filtered at 10 kHz and digitized at 20 μs; each 40th point is plotted. Membrane voltage and [Sr2+]i are indicated for each trace. (D) Sample record obtained with 5 μM [Ba2+]i and 100 μM [Ca2+]i at 50 mV from a different BK channel. Records were filtered at 10 kHz and digitized at 20 μs; each 100th point is plotted. The zero-current levels are indicated by dotted lines. Arrowheads in D indicate some long shut events shorter than 500 ms.

