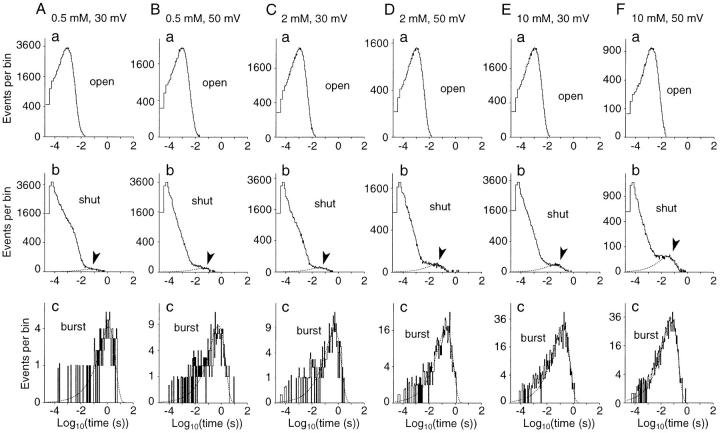
Figure 8.
Effects of Sr2+ and voltage on long shut events shown in histograms of event-duration distributions. (A–F) Histograms of open- (a), shut- (b), and burst- (c) time distributions from continuous records obtained from a BK channel at different [Sr2+]i and membrane voltages (indicated at the top of each column). Arrowheads in b indicate the portions of the long shut events (>20 ms) that were fitted with a single exponential (dotted curve). To discriminate burst events separated by long shut events, the time at which the number of long shut events shorter than this time equaled the number of ordinary shut events longer than this time was used as a threshold (4.3–16 ms). In c, each burst-time distribution was fitted with a single exponential (dotted curve). Record length was 156–204 s. Numbers of open, shut, burst, and long shut events, respectively, were 129,288, 129,288, 135, and 136 (0.5 mM, 30 mV); 97,865, 97,865, 275, and 276 (0.5 mM, 50 mV); 92,798, 92,799, 276, and 277 (2 mM, 30 mV); 58,494, 58,494, 580, and 581 (2 mM, 50 mV); 98,887, 98,887, 1,069, and 1,070 (10 mM, 30 mV); 34,052, 34,051, 1,151, and 1,151 (10 mM, 50 mV). The time constants of the exponentials for the duration of long shut events are 75.1, 44.7, 41.3, 41.0, 44.6, and 34.4 ms, respectively, for A–F. The time constants of the exponentials for the burst durations are 1,310, 631, 520, 195, 163, and 63.2 ms, respectively, for A–F.

