Figure 9.
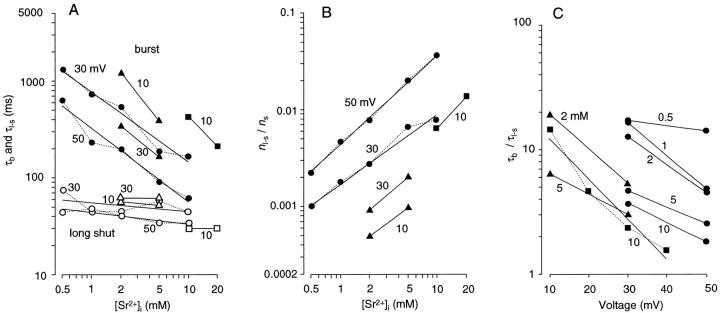
Concentration and voltage dependence of the parameters of the burst and slow blocked states. (A) The time constants of the exponentials that fit the burst duration (τb) (filled symbols) and long shut events (τl−s) (open symbols) (see Fig. 8) are plotted against [Sr2+]i. (B) The ratio of the occurrence of the blocked state versus other shut states (n1−s/ns) is plotted against [Sr2+]i. This fraction was calculated as the ratio of the area of the single-exponential component that fit long shut events (see Fig. 8, A–F, row b) to the total number of shut events counted. (C) Ratios of τb versus τl−s are plotted against membrane voltage. In A–C, different symbols indicate different membrane patches. More than two points obtained from the same membrane voltage in A and B or from the same [Sr2+]i in C are connected by dotted lines. Membrane voltage (in A and B) or [Sr2+]i (in C) for each set of points are indicated. The slopes of the lines that fit each set of points: burst in A, −0.74 (30 mV, circle), −0.74 (50 mV, circle), −1.00 (square), −1.23 (10 mV, triangle), −0.78 (30 mV, triangle); slow blocked in A, −0.094 (30 mV, circle), and −0.11 (50 mV, circle), −0.05 (square), 0.01 (30 mV, triangle), −0.15 (10 mV, triangle); n 1−s/n s in B, 0.92 (50 mV, circle) and 0.71 (30 mV, circle), 1.18 (square), 1.08 (30 mV, triangle), 0.95 (10 mV, triangle); τb/τl−s in C, log(e−0.0381-fold) mV−1 (circle, average), log(e−0.0737-fold) mV−1 (square), log(e−0.0506-fold) mV−1 (triangle, average).

