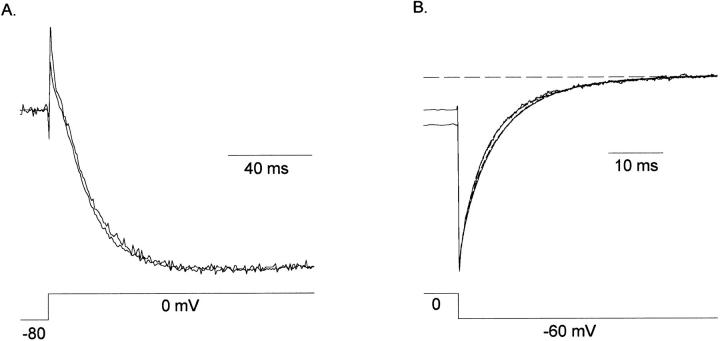
Figure 10.
Effect of external Na+ on K+ current activation, inactivation, and deactivation kinetics. These currents, carried by 3 mM external K+, were obtained in experiments as described in Fig. 5. (A) Two normalized traces are superimposed, one obtained in the absence of external Na+, one obtained in the presence of 100 mM external Na+. In this cell, 100 mM Na+ blocked the K+ current by 42% at 0 mV. The activation time course for both currents was well-fit by a single exponential function, with time constants of 16.84 ± 1.87 and 18.50 ± 2.25 ms, in the absence and presence of Na+, respectively (n = 5). (B) Two normalized tail currents (solid lines) are superimposed, recorded in the absence and presence of Na+. Also superimposed on these currents are double exponential fits (dashed lines), which yielded identical fast and slow time constants under the two conditions (τ1 = 5.98 ± 0.43 and 4.81 ± 0.62 ms, respectively; τ2 = 2.49 ± 0.56 and 1.29 ± 0.49 ms, respectively; n = 5). In this cell, 100 mM Na+ blocked the tail current by 49%. The horizontal dashed line represents the 0 current baseline.

