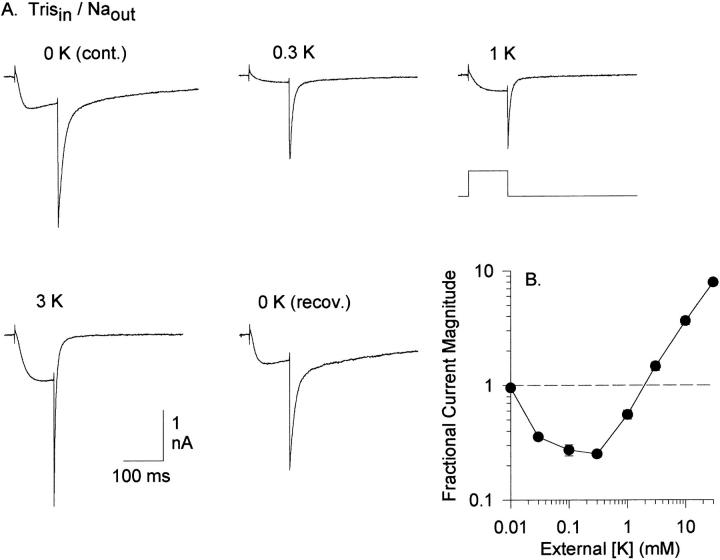
Figure 3.
Anomalous mole fraction behavior between K+ and Na+. (A) Traces were evoked by a 100-ms depolarization to 0 mV. For all traces, the internal solution contained 140 mM TrisCl and the external solution contained 160 mM NaCl. Currents were recorded in the presence of the indicated [K+] from a single cell. (B) Complete anomalous mole fraction curve; data points represent measurements from 4–12 cells. At all concentrations, external K+ was added to the control external solution. Currents were recorded sequentially at increasing [K+], with the external solution being returned to the 0 mM K+ solution between each application of a different [K+]. Fractional current magnitude was calculated by measuring the peak inward current at 0 mV for each [K+], normalized to the current magnitude for the current evoked in 0 mM K+ immediately preceding it.

