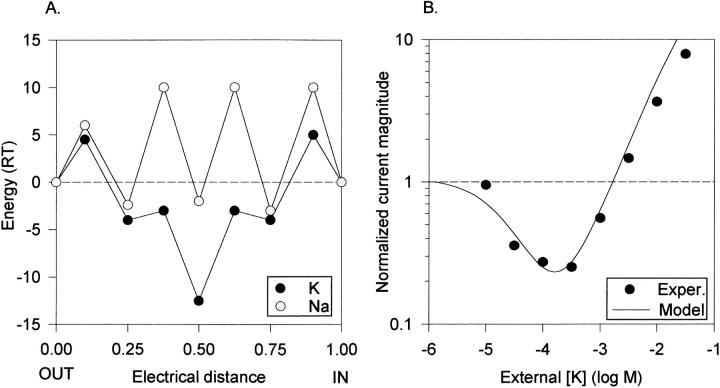
Figure 4.
Single high affinity site model of the K+ channel permeation pathway. (A) Free energy diagram, illustrating ionic free energy for K+ (dark circles) and Na+ (light circles) as a function of distance in the membrane field. The central free energy well represents a high affinity binding site selective for K+. The wells at electrical distances of 0.25 and 0.75 are low affinity and relatively nonselective. The external solution is at electrical distance 0.00. No attempt was made to optimize placement of the wells within the field, as we do not have sufficient experimental data to do so. However, limited manipulation of distance parameters indicated that they had little influence on the predicted results. Energy maxima for K+ (all values are listed from outside to inside, in RT units): 4.5, −3, −3, and 5. Energy minima for K+: −4, −12.5, and −4. Energy maxima for Na+: 6, 10, 10, and 10. Energy minima for Na+: −2.4, −2, and −3. (B) Predicted anomalous mole fraction curve (solid line) generated by the model in A, under the experimental conditions of Fig. 3 B. The data points are a replotting of the data in Fig. 3 B, without error bars, for comparison.

