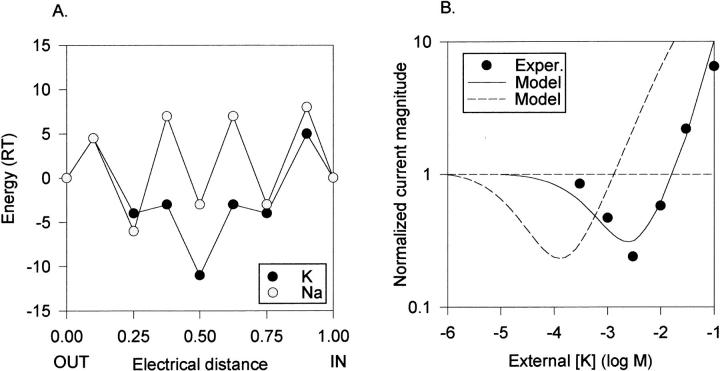
Figure 6.
Model of Kv2.1 experimental data. (A) Free energy diagram as in Fig. 4 A, except with the following parameters: Energy maxima for K+: 4.5, −3, −3, and 5. Energy minima for K+: −4, −11, and −4. Energy maxima for Na+: 4.5, 7, 7, and 8. Energy minima for Na+: −6, −3, and −3. (B, •) Anomalous mole fraction behavior between K+ and Na+ in Kv2.1, adapted from Korn and Ikeda (1995). (B, solid line) Anomalous mole fraction behavior predicted by the model in A, for the conditions of the experimental data collection. The curve at [K+] higher than 3 mM represents connected points in a discontinuous function, as the experimental data above these concentrations were collected by substituting K+ for equimolar concentrations of Na+. (B, dashed line) Replot of the predicted curve in Fig. 4 B for comparison.

