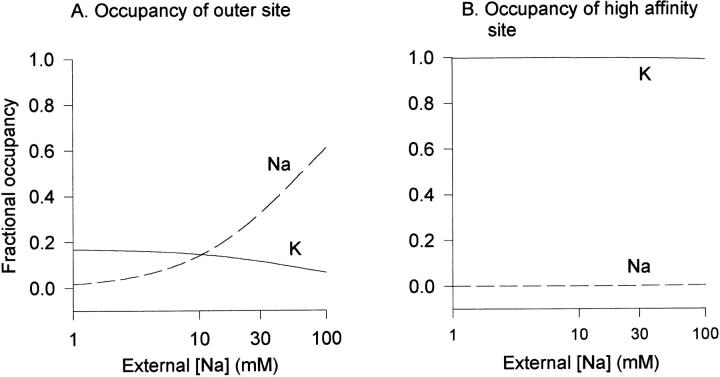
Figure 8.
Predicted binding site occupancy with 3 mM external K+ and increasing external [Na+]. Model parameters from Fig. 4 A were used, as in Fig. 7, except that voltage was set to the experimentally used repolarization potential of −60 mV to maximize the possibility that Na+ would reach the high affinity site. (A) Fractional occupancy of the outer, low affinity site by Na+ and K+. (B) Fractional occupancy of the central, high affinity site by Na+ and K+.

