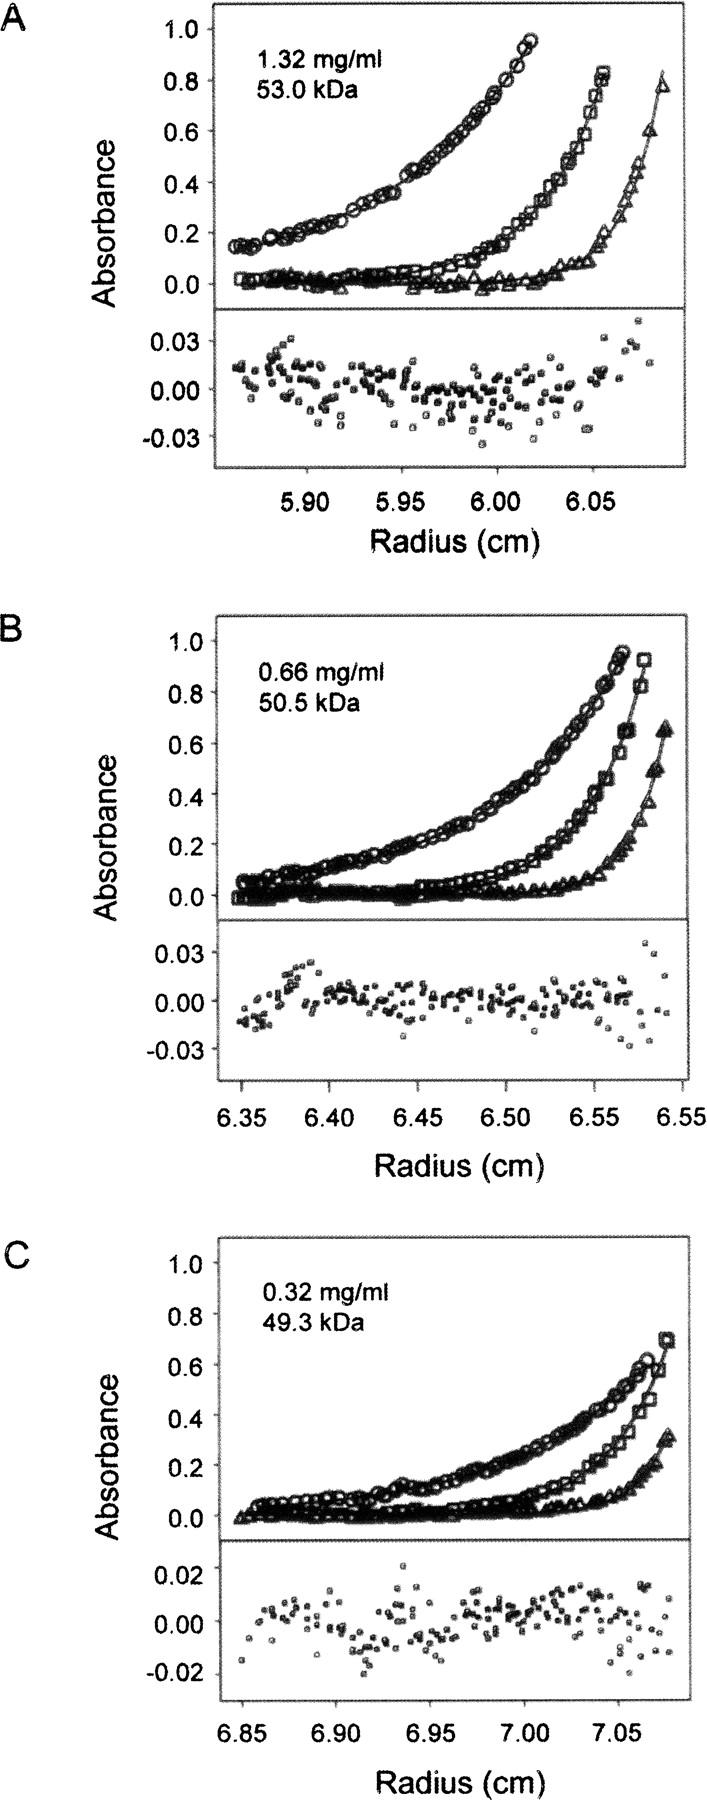
Figure 1.

Sedimentation equilibrium analysis of recombinant full-length Eap protein. The individual panels (A–C) show experimental data obtained at 20 (circles), 30 (squares), and 40 k.r.p.m. (triangles) at the Eap concentrations indicated. Equilibrium profiles were fit separately for each concentration (black lines) according to the single particle model described in Materials and Methods to yield the observed molecular mass of the protein. The determined molecular mass of 50.9 ± 1.5 kDa corresponds to monomeric Eap within the 68% confidence interval. Bottom plots show random residuals of the fits.
