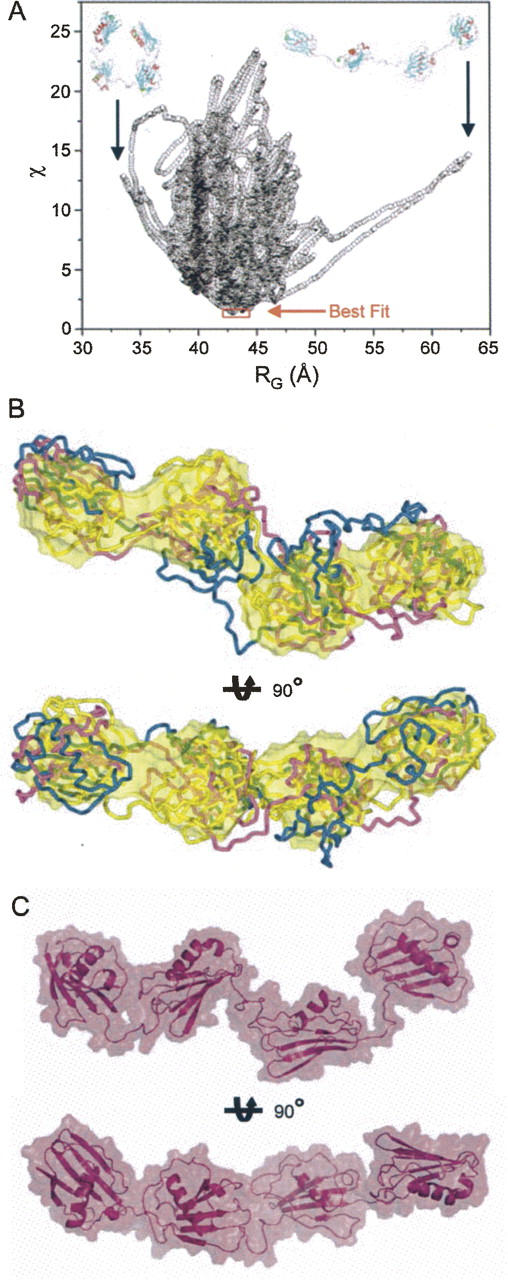
Figure 5.

Rigid body molecular dynamics models for Eap. Molecular models for the individual EAP domains were generated on the basis of homology with the EAP2 crystal structure (PDB accession code 1YN3) (Geisbrecht et al. 2005). The resulting homology models were considered as rigid bodies in MD simulations to generate potential solution structures of full-length Eap that were consistent with the molecular parameters determined experimentally by SAXS. (A) A graphical comparison of discrepancy values (χ) for 15,000 rigid body models of Eap is shown along with their calculated RG values. The best fitting models are indicated by red frame. Note that the small subset of best fitting models all lay within the region of experimentally determined RG values (Fig. 3). For the sake of comparison, rigid body solutions for the Eap solution structure that adopt extremely stretched (D max > 200 Å, RG ∼ 63 Å) or collapsed conformations (D max < 100 Å, RG ∼ 34 Å−1), respectively, are shown in inset. (B) Three best fit models derived from independent solutions were superimposed onto the surface of the ab intio model shown in Figure 4B. The secondary structural elements of the different models are shown in Cα tube representations and colored blue, purple, and gold, respectively. The bottom models are rotated clockwise by 90° around the X-axis, as indicated. (C) Two orthogonal views of the best fit model in surface representation superimposed on the secondary structure elements.
