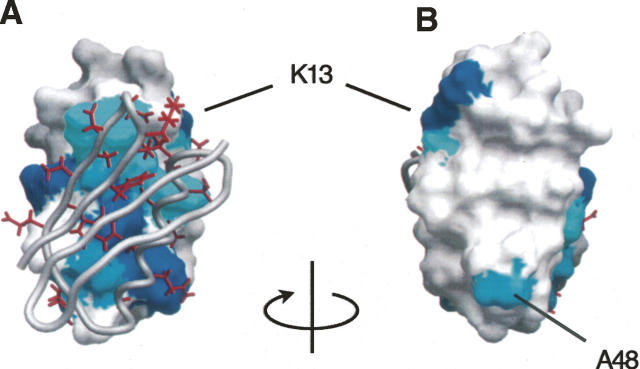
Figure 3.
(A) Chemical shift perturbations mapped to the surface of GB1A in the docked model orientation together with GB1B shown as a gray backbone worm on which the interfacial side chains are colored red. (Dark blue) Residues with nonobservable [15N, 1H] HSQC peaks; (lighter blue) those that exhibit chemical shift changes. (B) 180° rotation of A.

