
Figure 2.
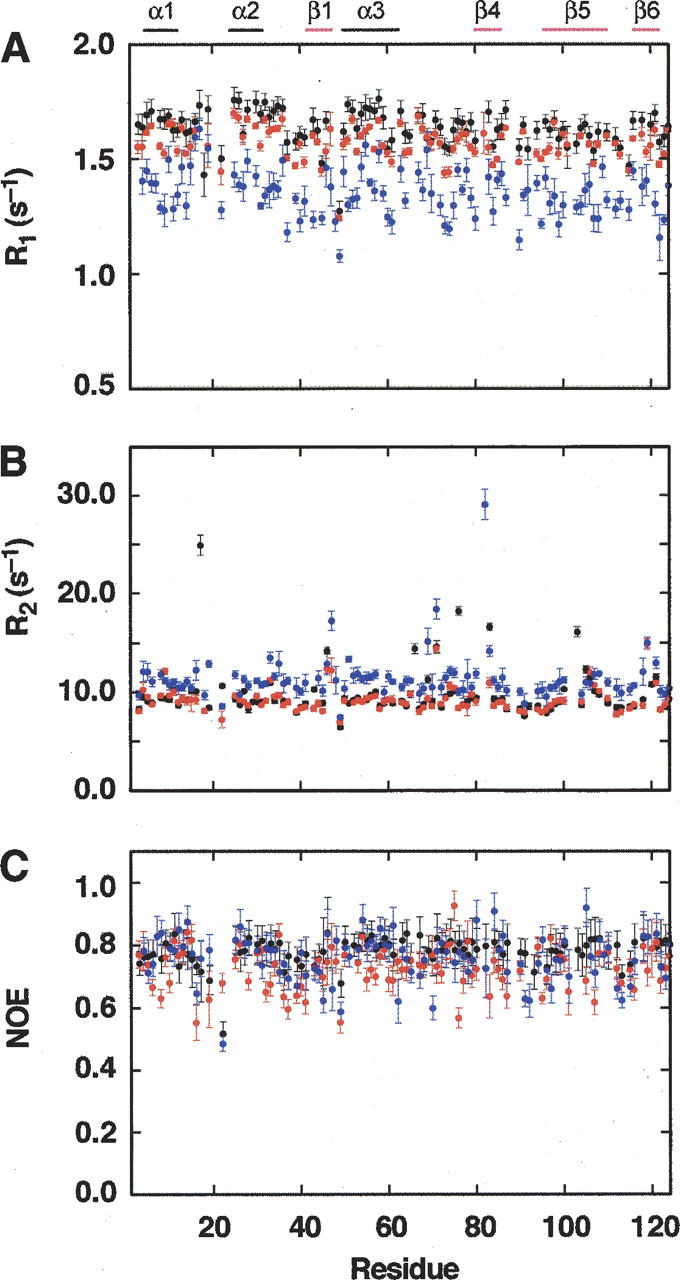
Residue-specific NMR spin-relaxation rates. Longitudinal (R 1) (A) and transverse (R 2) (B) relaxation rates and the steady-state heteronuclear NOE (C) are shown as a function of the RNase A primary sequence for native RNase A (black circles), RNase A + 700 mM guanidine hydrochloride (red circles), and RNase A + 700 mM guanidine hydrochloride + 350 mM TMAO (blue circles). The location of secondary structure elements is shown at the top of the figure.