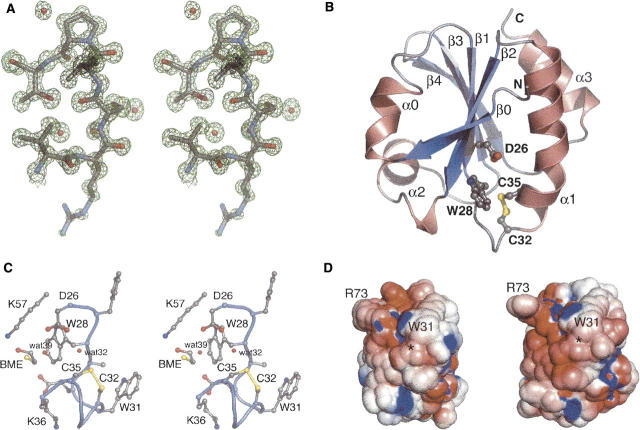
Figure 3.
(A) Stereo view of a representative portion of the σA-weighted 2F o-F c map calculated using the final refined structure. The map is contoured at 1.5 σ. Pro76, a cis proline, is shown at top. The side chain of Arg73, shown at the bottom, is solvent exposed and somewhat disordered. (B) Ribbon diagram of AaTrx. Helices and strands are numbered according to the Trx fold (Martin 1995) and correspond to residues 4–8 (β0), 9–15 (α0), 22–27 (β1), 33–49 (α1), 53–59 (β2), 60–70 (α2, interrupted by Pro64), 77–82 (β3), 85–91 (β4), and 96–105 (α3). Selected residues are shown in ball-and-stick representation. The termini are labeled with N and C, respectively. (C) Stereo view of a ball-and-stick representation of selected residues near the AaTrx active site. (D) Electrostatic rendering of the solvent-accessible surface of AaTrx (left) and EcTrx (right), computed at pH 7 with (red) −5 kT/e and (blue) +5 kT/e. Locations of Trp31 and Arg73 are located for orientation. The location of the Cys32–Cys35 disulfide is marked with an asterisk.

