
Figure 3.
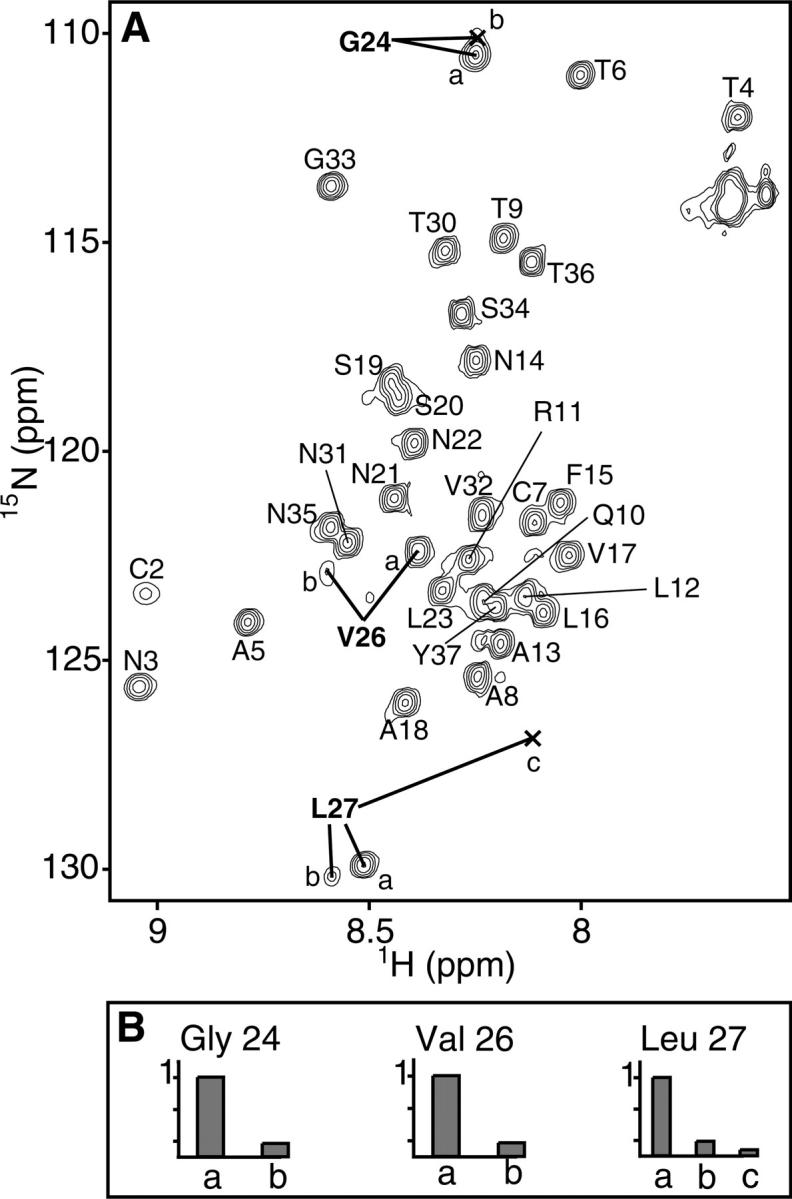
(A) 15N-HSQC spectrum of rat IAPP. Multiple resonances observed for Gly24, Val26, and Leu27 are indicated with bold lines. (B) Relative peak heights for Gly24, Val26, and Leu27 indicated in A normalized to the most intense peak.
Official websites use .gov
A
.gov website belongs to an official
government organization in the United States.
Secure .gov websites use HTTPS
A lock (
) or https:// means you've safely
connected to the .gov website. Share sensitive
information only on official, secure websites.
(A) 15N-HSQC spectrum of rat IAPP. Multiple resonances observed for Gly24, Val26, and Leu27 are indicated with bold lines. (B) Relative peak heights for Gly24, Val26, and Leu27 indicated in A normalized to the most intense peak.