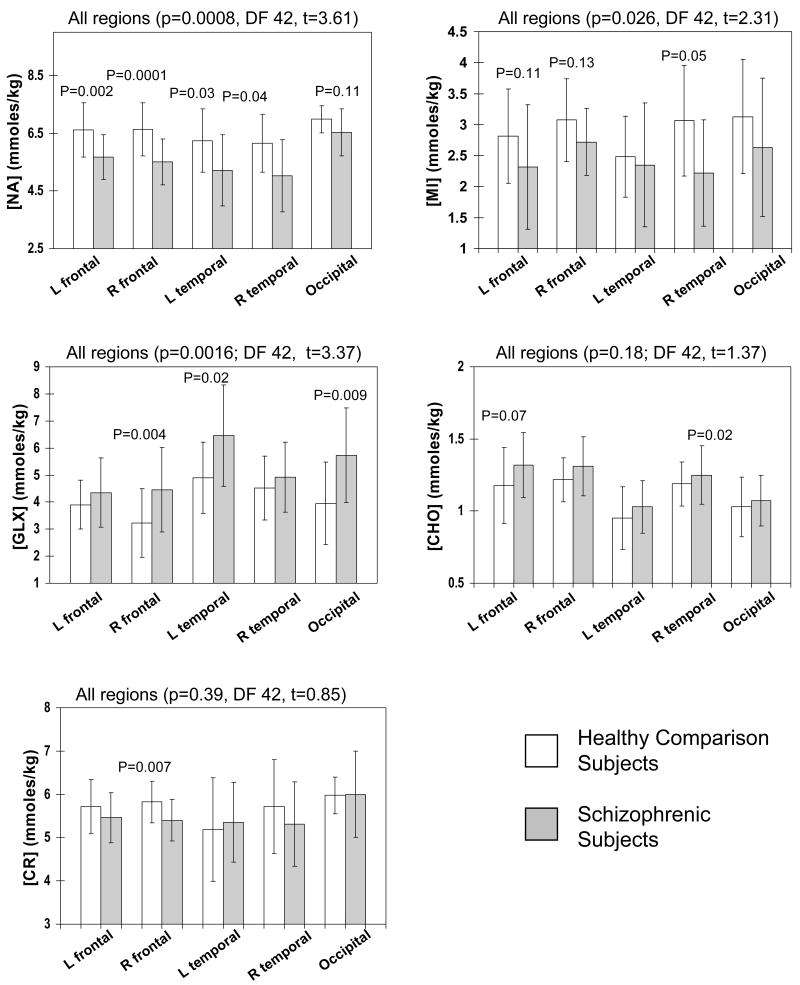
Figure 2.
Metabolite levels in all brain regions. Relative to comparison participants, those with schizophrenia show decreased NA, lower MI and elevated GLX when metabolites in all regions were averages. Regionally, schizophrenic subjects showed lower NA in frontal and temporal white matter regions, lower MI but higher GLX, and mildly increased CHO in most regions, but not all regions show statistical significance. Error bars indicate ±1 standard deviation.

