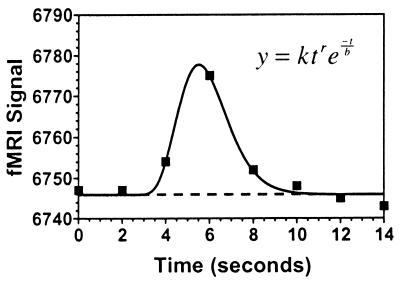
Figure 2.
ER–fMRI time-series analysis. Example of an average fMRI time series, time-locked to correct response inhibitions, taken from a voxel in the dorsolateral prefrontal cortex of one subject. The averaged data are represented by ■ and the best-fitting γ-variate function is represented by the smooth line. The portion of the curve before departure from baseline was fitted with a flat line. Departure points were constrained to occur within 4 sec of the lure presentation. The scaling parameter, k, was free to vary, whereas the exponential parameters were constrained as follows: 8 ≤ r ≤ 9, 0.15 ≤ b ≤ 0.45. To provide a measure of the response magnitude, the area under the curve was expressed as a percentage of the area under the baseline, determined by the linear portion of the fitted model and its continuation (shown as a dashed line).

