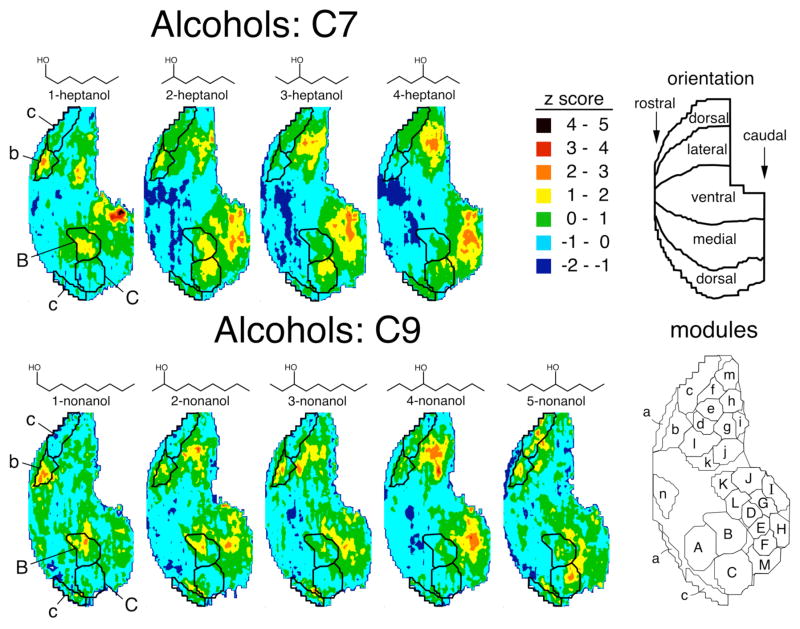
Fig. 1.
Color-coded contour charts illustrating patterns of glomerular layer 2-DG uptake evoked by alcohol odorants. These charts represent data matrices averaged across multiple rats and are presented as rolled-out maps of the glomerular layer as if a cut had been made dorsally running anterior to posterior. Anterior is located on the left and lateral is in the top half of the charts. The ventral surface is positioned horizontally at the center of each chart (see “orientation” panel). The amount of uptake in units of z scores is indicated using colors as shown in the key. The “modules” inset shows locations of glomerular modules derived from responses to 54 previously studied odorants (Johnson et al., 2002). Modules discussed in depth regarding the representations of the odorants are superimposed on the contour charts. Dorsal-centered and simulated 3-dimensional versions of the same patterns can be found on our website (http://leonlab.bio.uci.edu).

