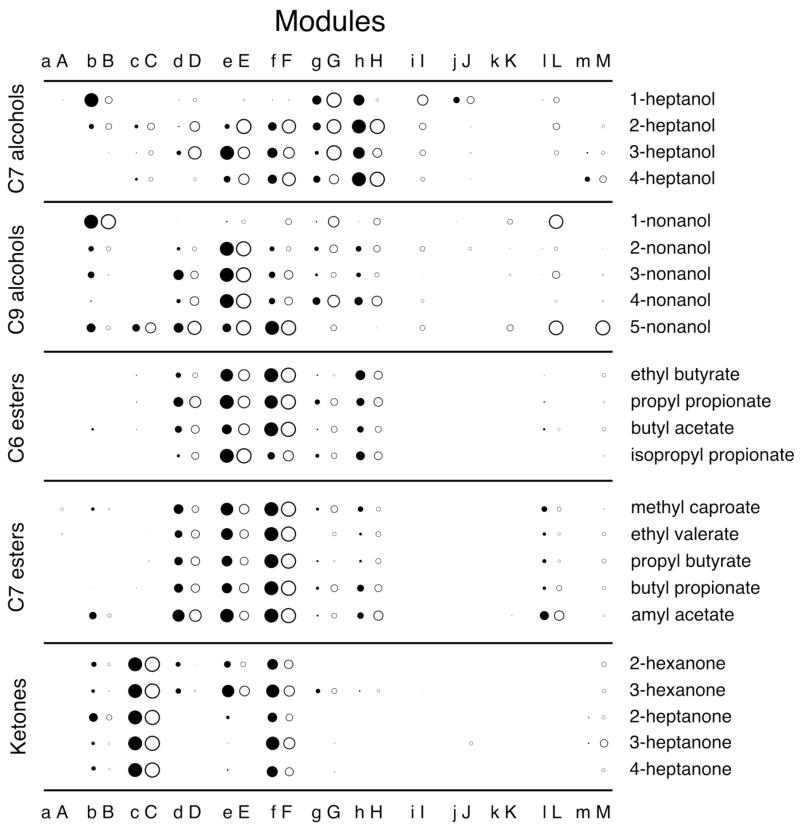
Fig. 2.
Modular responses. Uptake of 2-DG across each module (see Figure 1) was averaged for each odorant-evoked z score pattern. Each modular value then was expressed as a fraction of the maximum modular value evoked by the same odorant in the same bulbar aspect (lateral or medial). These ratios were used to adjust the diameters of circles to represent the relative stimulation of each module. Only positive values are shown. Lateral modules are labeled with lower case letters and are symbolized using solid circles, while paired medial modules are labeled with the corresponding upper case letter and are symbolized by open circles. The similarity in the average activation of paired modules likely represents the paired lateral and medial projection of sensory neurons expressing the same odorant receptor gene (Vassar et al., 1999; Ressler et al., 1999). Because uptake is averaged across entire modules, small foci of elevated 2-DG uptake, such as those occurring in module “A” for ethyl butyrate, propyl propionate, methyl caproate, and ethyl valerate (see Figure 1) are diminished in impact or even obscured in this figure, which nevertheless captures and simplifies the principal differences in the representations of both different functional groups (e.g., esters versus ketones) and different isomers (e.g., 1-heptanol versus 4-heptanol or 1-nonanol versus 4-nonanol).

