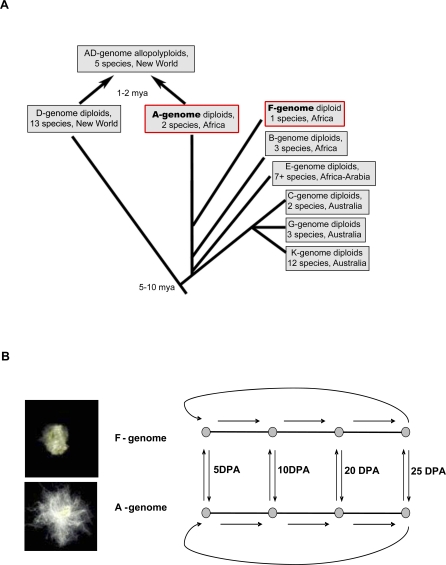
Figure 1. Evolutionary History of Cotton in Relation to the Current Study.
(A) Evolutionary history of diploid and tetraploid Gossypium species groups (n = 13 and 26, respectively), as inferred from multiple molecular datasets [11,13], indicating sister-taxon relationship between the F- and A- genomes. F-, G. longicalyx (short fibers); A-, G. herbaceum (long fibers).
(B) Microarray experimental loop-design for detecting gene expression changes during the development of A- and F-genome fibers. Arrows denote dyes that were used in each of the hybridizations (tails, Cy3; arrow heads, Cy5).

