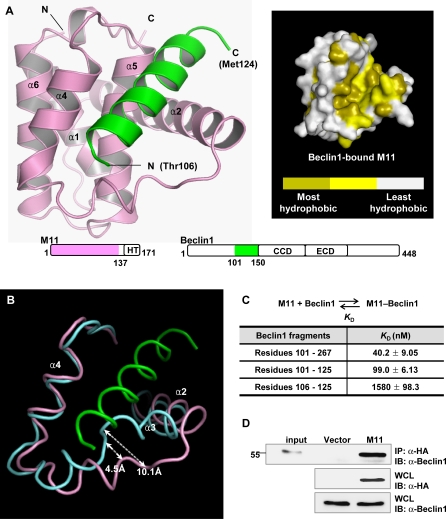
Figure 1. Structural and Binding Analyses of the M11–Beclin1(101–150) Complex.
(A) Ribbon drawing (left) and surface presentation (right). M11 is in pink, while the Beclin1 helix is in green. The pink and green regions on the primary sequence diagrams indicate the fragments of the M11 and Beclin1 used for the structure determination. “HT”, “CCD” and “ECD” denote hydrophobic tail, coiled-coil domain and evolutionarily conserved domain, respectively. Only 19 amino acids of Beclin1 exhibited well-defined electron density. A surface presentation of M11 with the omission of the Beclin1 helix shows that the BH3-binding groove is predominantly hydrophobic. The surface coloring scheme is as follows: olive for Val, Leu, Ile, Phe, Trp, Met, and Ala; yellow for Cys, Gly, Tyr, and Pro; gray for other amino acids.
(B) Large conformational change of M11 induced by the Beclin1 binding. Only the BH3-binding groove region of M11 is shown for clarity. Beclin1(101–150)-bound M11 (pink) and free M11 (cyan) are superposed. The bound Beclin1 peptide is in green. Helix α3 of M11 undergoes a pronounced conformational change. The arrows indicate the movements of the Cα atoms of Asp59 and Tyr60 in M11.
(C) ITC analysis. The measurements were carried out by titrating 0.1 mM of M11 into 5 μM of the indicated Beclin1 fragments. The K D values were deduced from curve fittings of the integrated heat per mol of added ligand and summarized in the table.
(D) M11 interacts with endogenous Beclin1. NIH3T3 cells were transfected with HA-tagged M11 and whole cell lysates were used for immunoprecipitation with anti-HA followed by immunoblotting with anti-Beclin1

