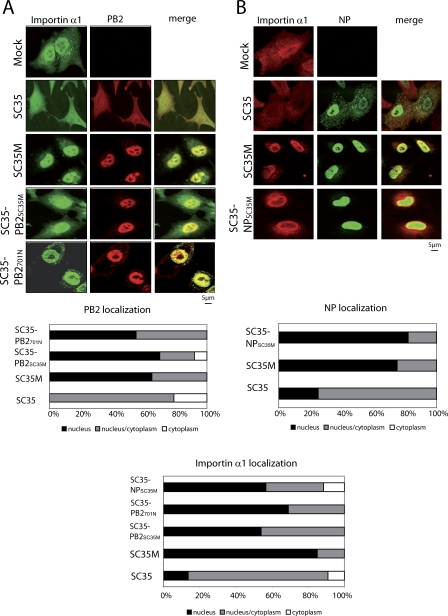
Figure 6. Localization of PB2, NP, and Importin α1 in Mammalian Cells by Immunofluorescence Analysis.
A549 cells were infected with SC35, SC35M, SC35-PB2SC35M, and SC35-PB2701N (MOI 2). 6 h p.i. cells were stained with antisera specific for importin α1 (secondary antibody FITC-coupled) and PB2 (secondary antibody Rhodamine-coupled) (A) or importin α1 (secondary antibody Rhodamine-coupled) and NP (secondary antibody FITC-coupled) (B). The amounts of PB2, NP, and importin α1 in the nucleus and the cytoplasm are indicated by bars. Quantification was done as described in Materials and Methods.

