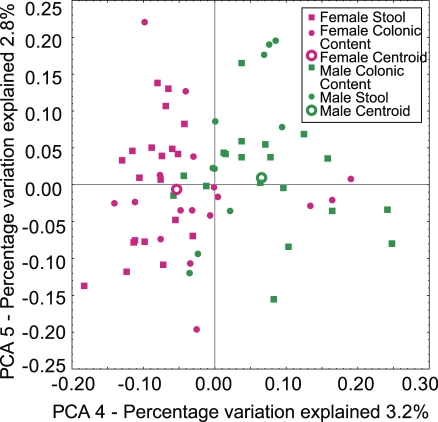
Figure 6. Sexual Dimorphism in the Macaque GI Microbiota.
Samples of stool and colonic contents are combined for this analysis. Cluster analysis was carried out using unweighted UniFrac. Separation between male communities (green) and female communities (pink) was significant (p < 0.05, t-test with permutation; analysis over all variation between samples). Note that with the simplest null model, we expect each Principal Coordinate to explain 100/number of samples, which is 100/100 communities = 1% of the variation. Thus the fourth Principal Coordinate, which separates males and females, is expected to contain meaningful information.

