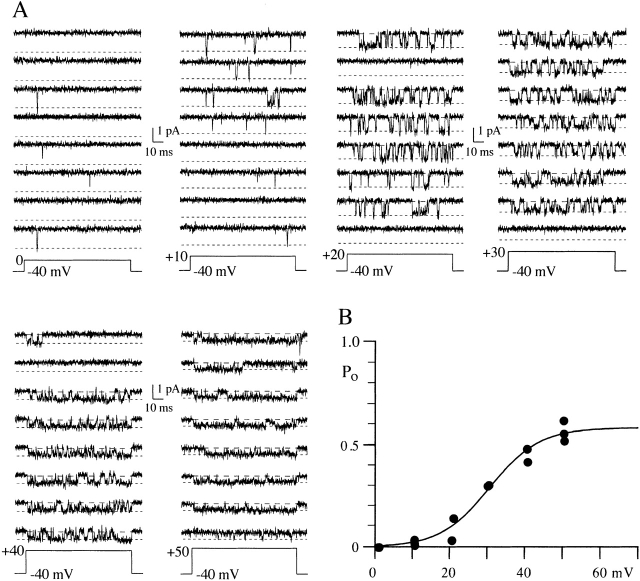
Figure 1.
Effect of voltage on N-channel gating. (A) Eight consecutive sweeps are shown for each voltage. This patch contained one N-channel and at least one Ef-channel. The illustrated records were Gaussian filtered at 1 kHz. The two dashed lines indicate the channel open level (short dashes) and the baseline (long dashes). (B) P o vs. voltage relation for the patch illustrated in A. P o was measured from 100-ms voltage steps ranging from 0 to +50 mV, and each symbol is the mean P o (included nulls) calculated from a 100-sweep data set. Multiple data sets were obtained at each voltage. The solid line is from a single Boltzmann fit to all points. The parameters for the line are V1/2 = 31 mV, slope = e-fold for 7 mV, and maximum P o = 0.58.

